Tips & Guides - 13 May 2026
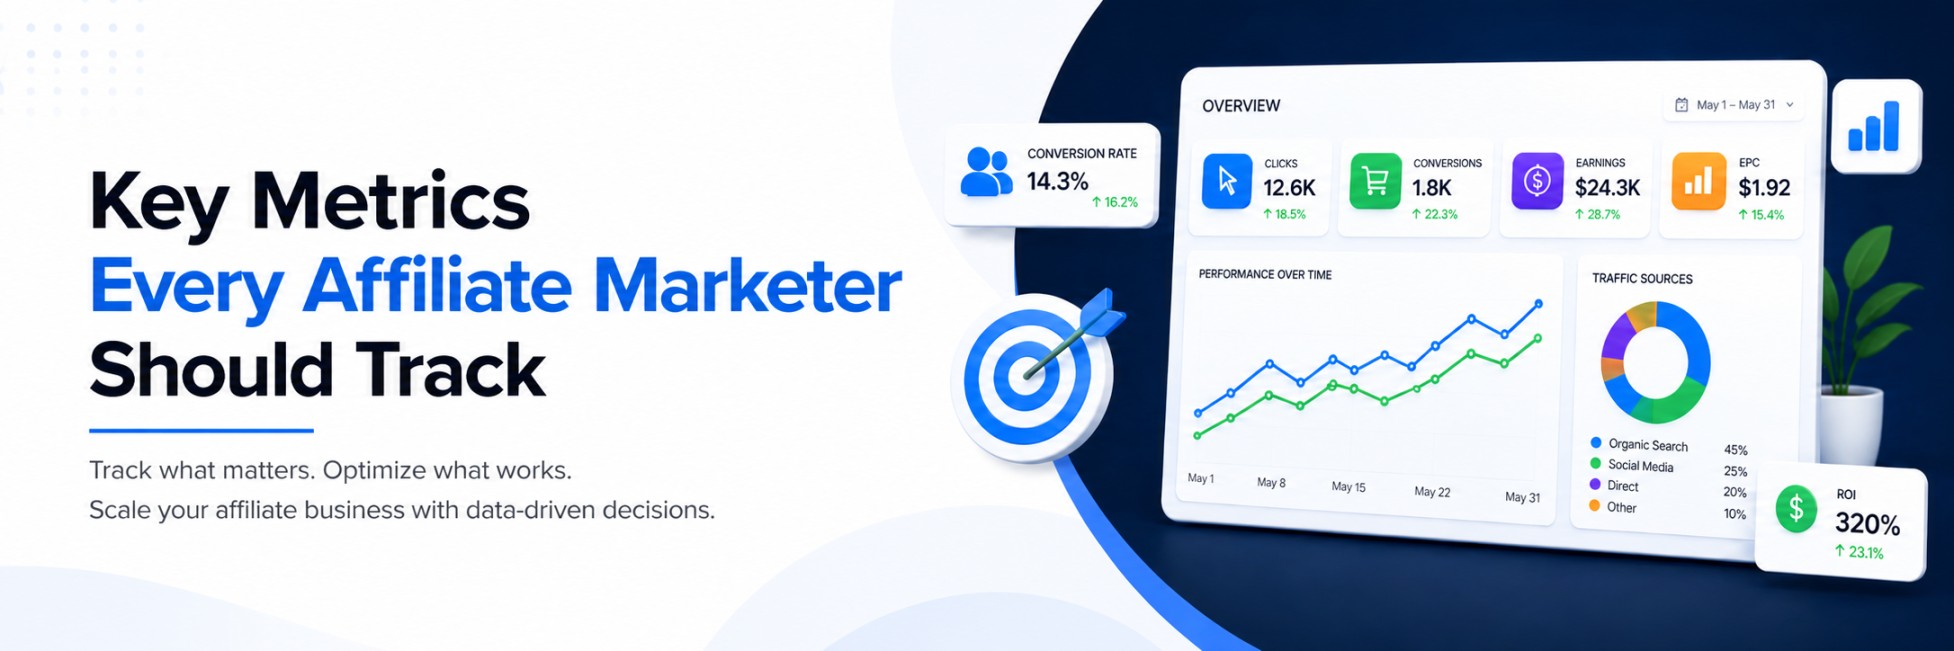
Visual Insights for Smarter Performance Tracking
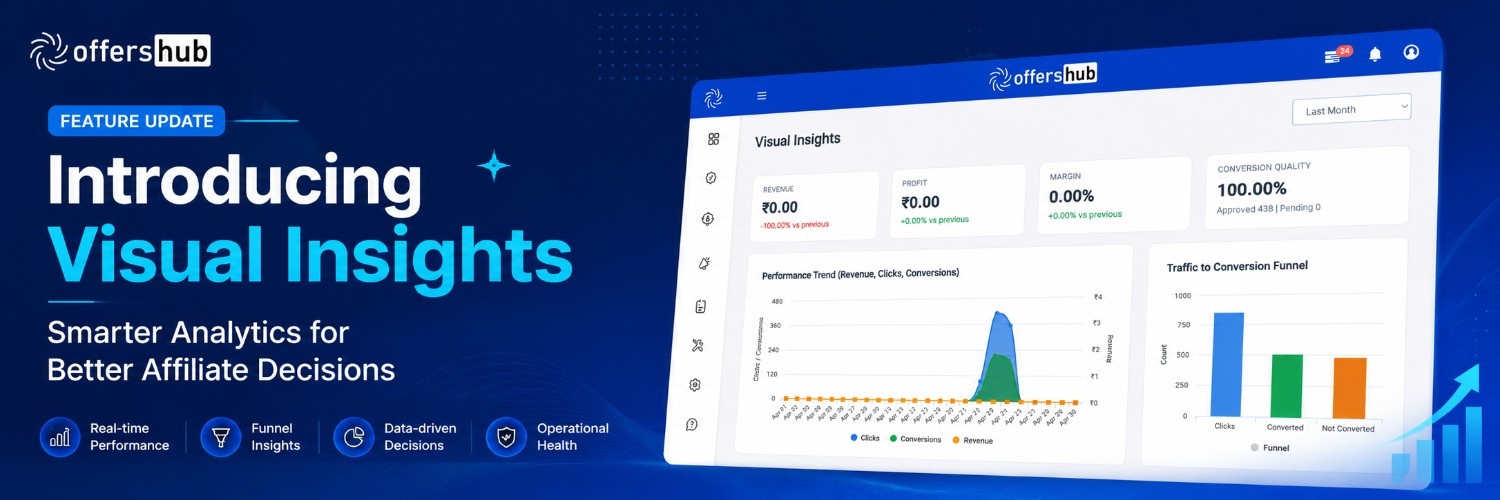
Product Update


At OffersHub, we’re constantly working to make affiliate tracking and performance analysis simpler, faster, and more actionable.
We’re excited to introduce our latest feature update: Visual Insights — a powerful analytics dashboard designed to help networks, agencies, and advertisers quickly understand campaign performance through clean visual reporting.
Instead of digging through multiple reports and spreadsheets, you can now view your most important business metrics in one centralized dashboard.
Visual Insights is an advanced analytics layer inside OffersHub that transforms raw tracking data into meaningful visual reports.
All in a single dashboard.
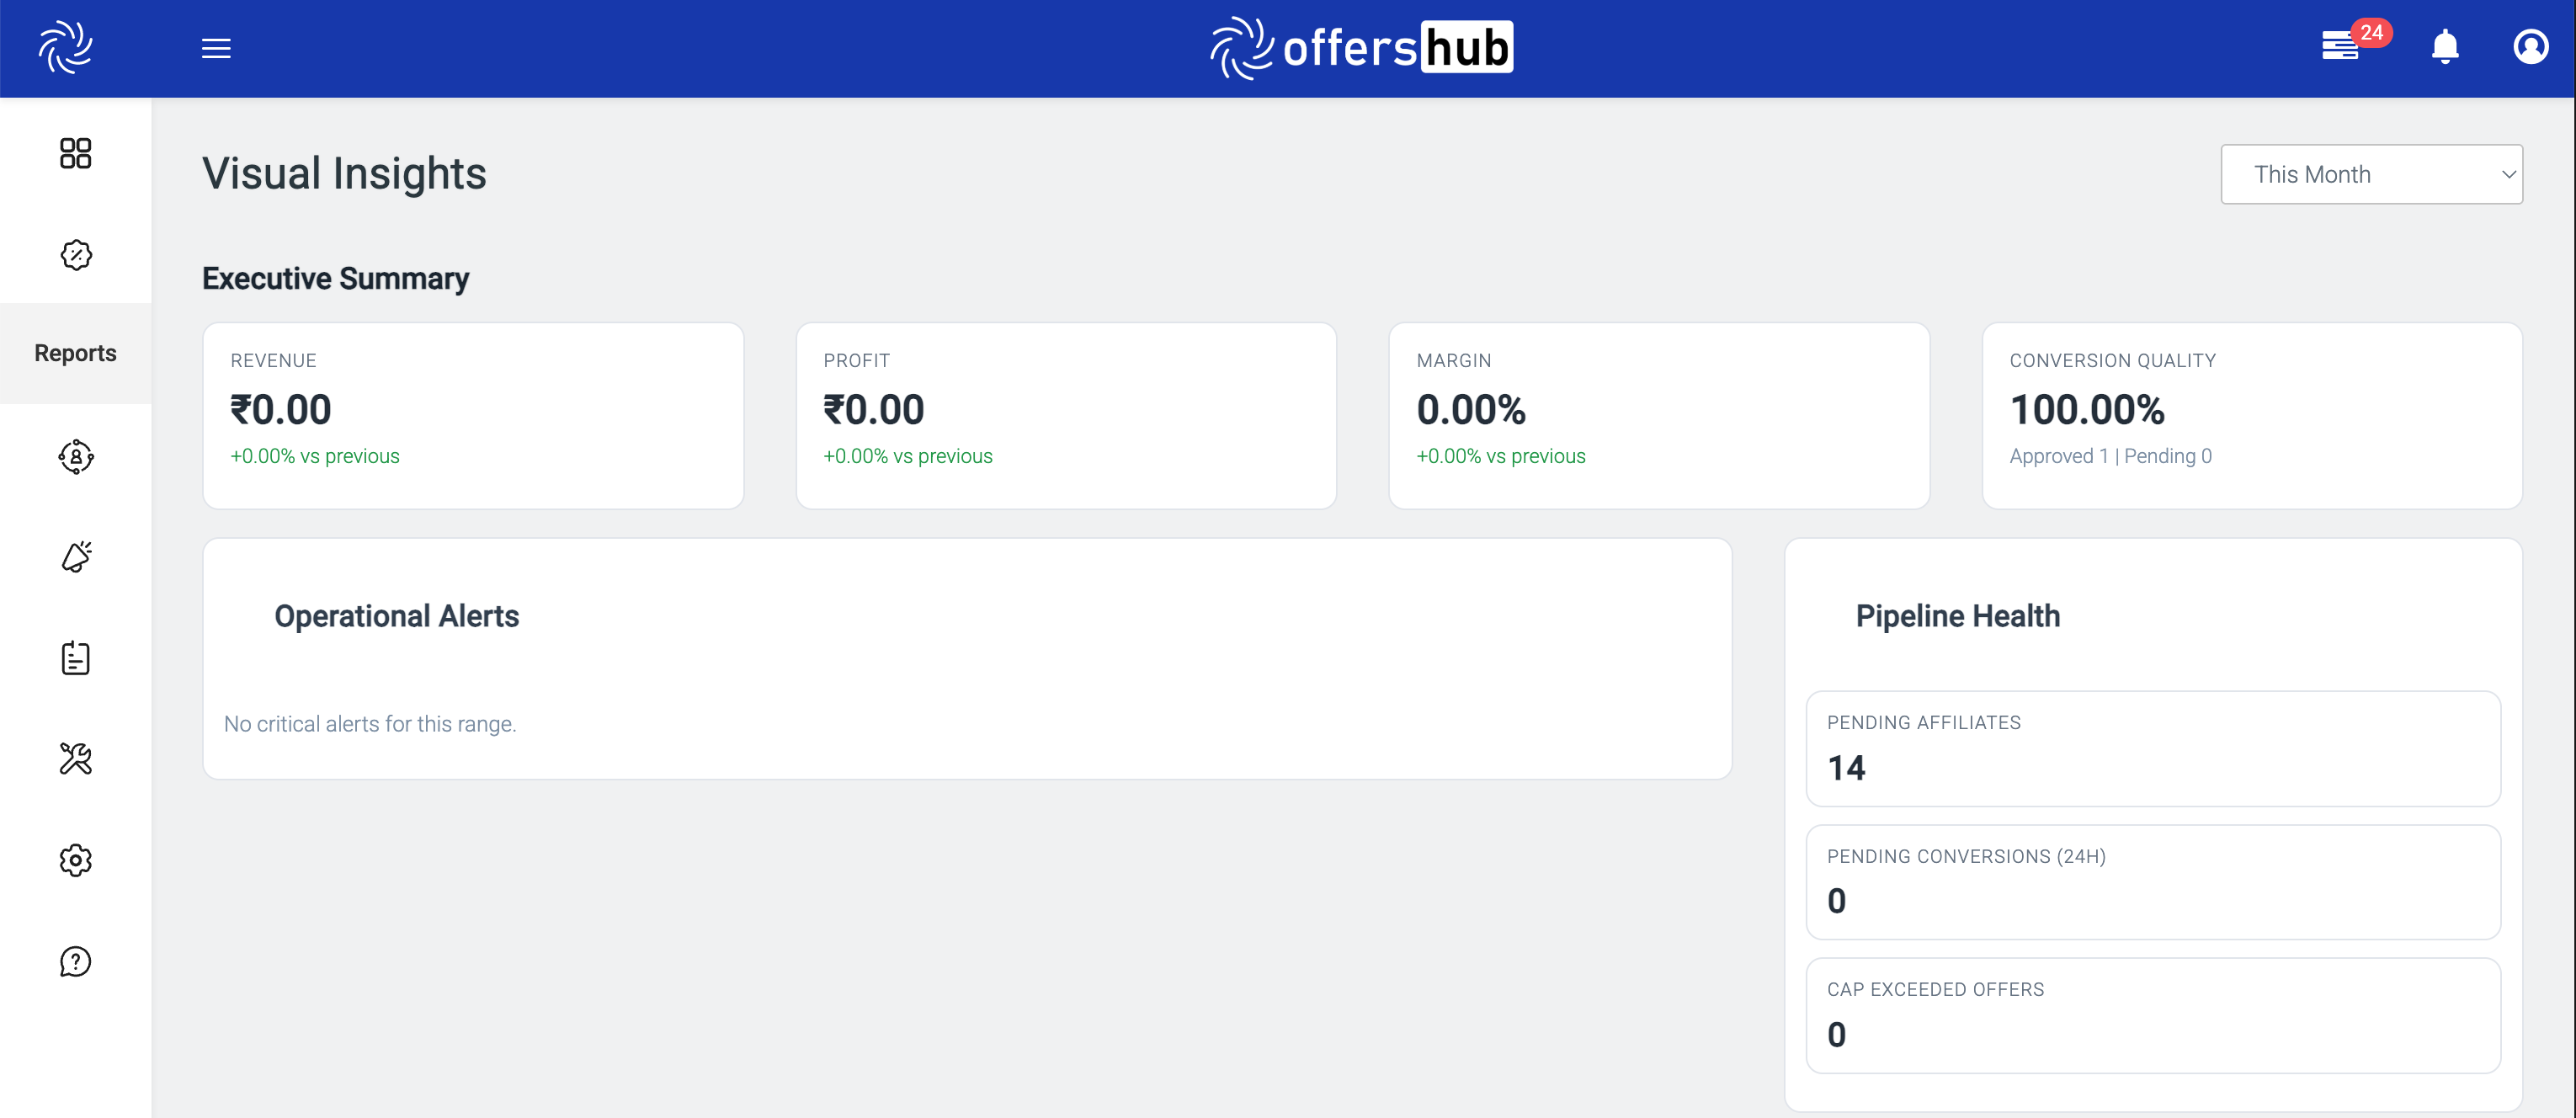
Executive Summary Dashboard:Get a high-level overview of your business performance instantly with metrics like revenue, profit, margin, and conversion quality. This helps teams quickly identify performance shifts without opening multiple reports.
Performance Trends:Track clicks, conversions, and revenue trends visually over time.Spot traffic spikes
Perfect for daily optimization and performance monitoring.
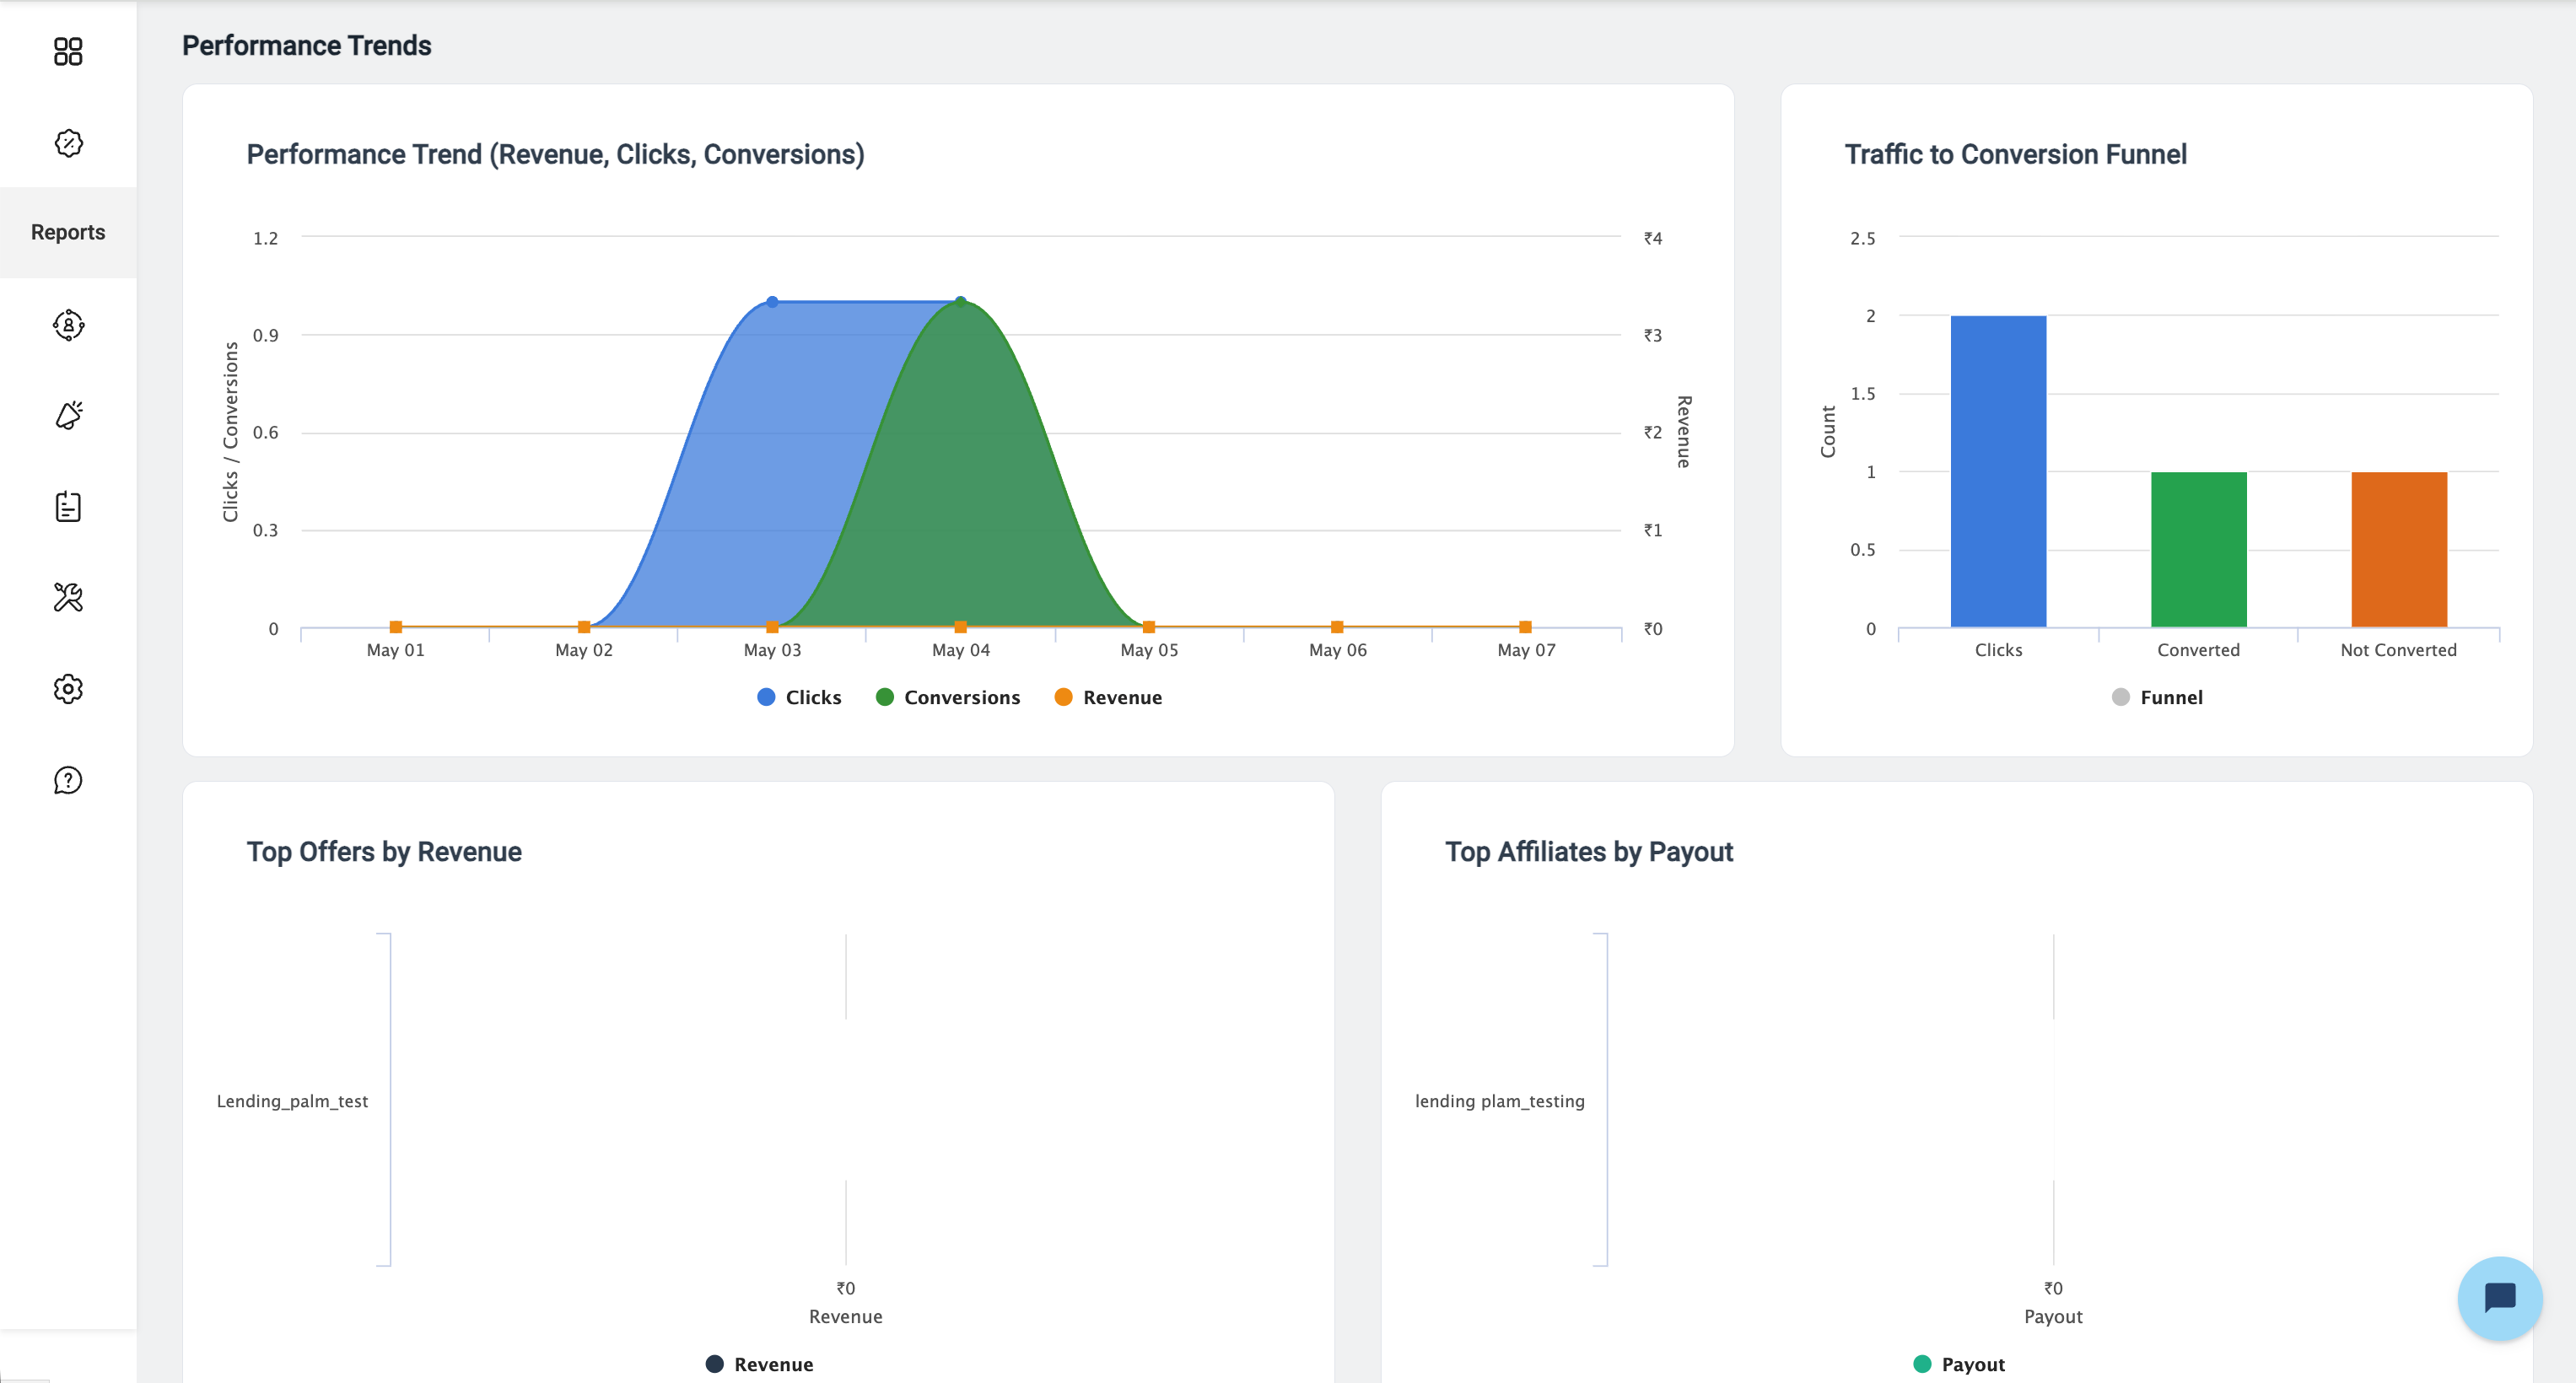
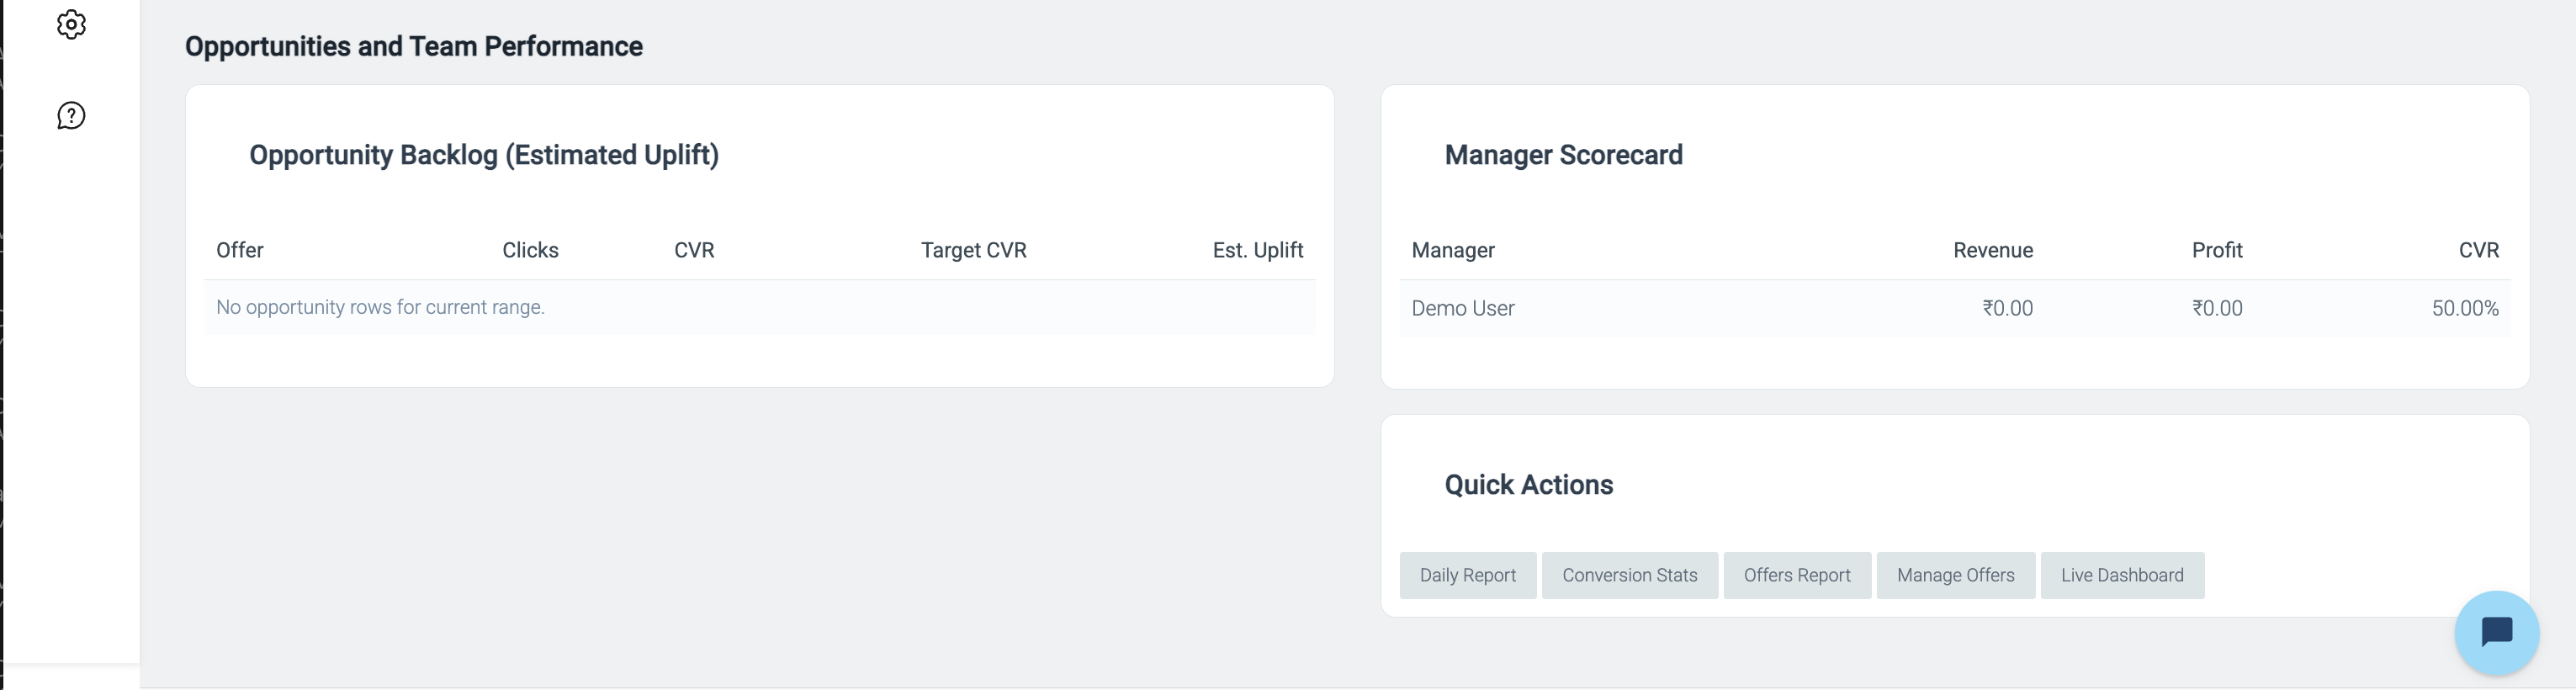
Understand how your traffic moves through the conversion journey with visual funnel insights.
This makes campaign optimization faster and more data-driven.
Analyze traffic distribution by countries, devices, and operating systems to identify high-performing traffic sources.
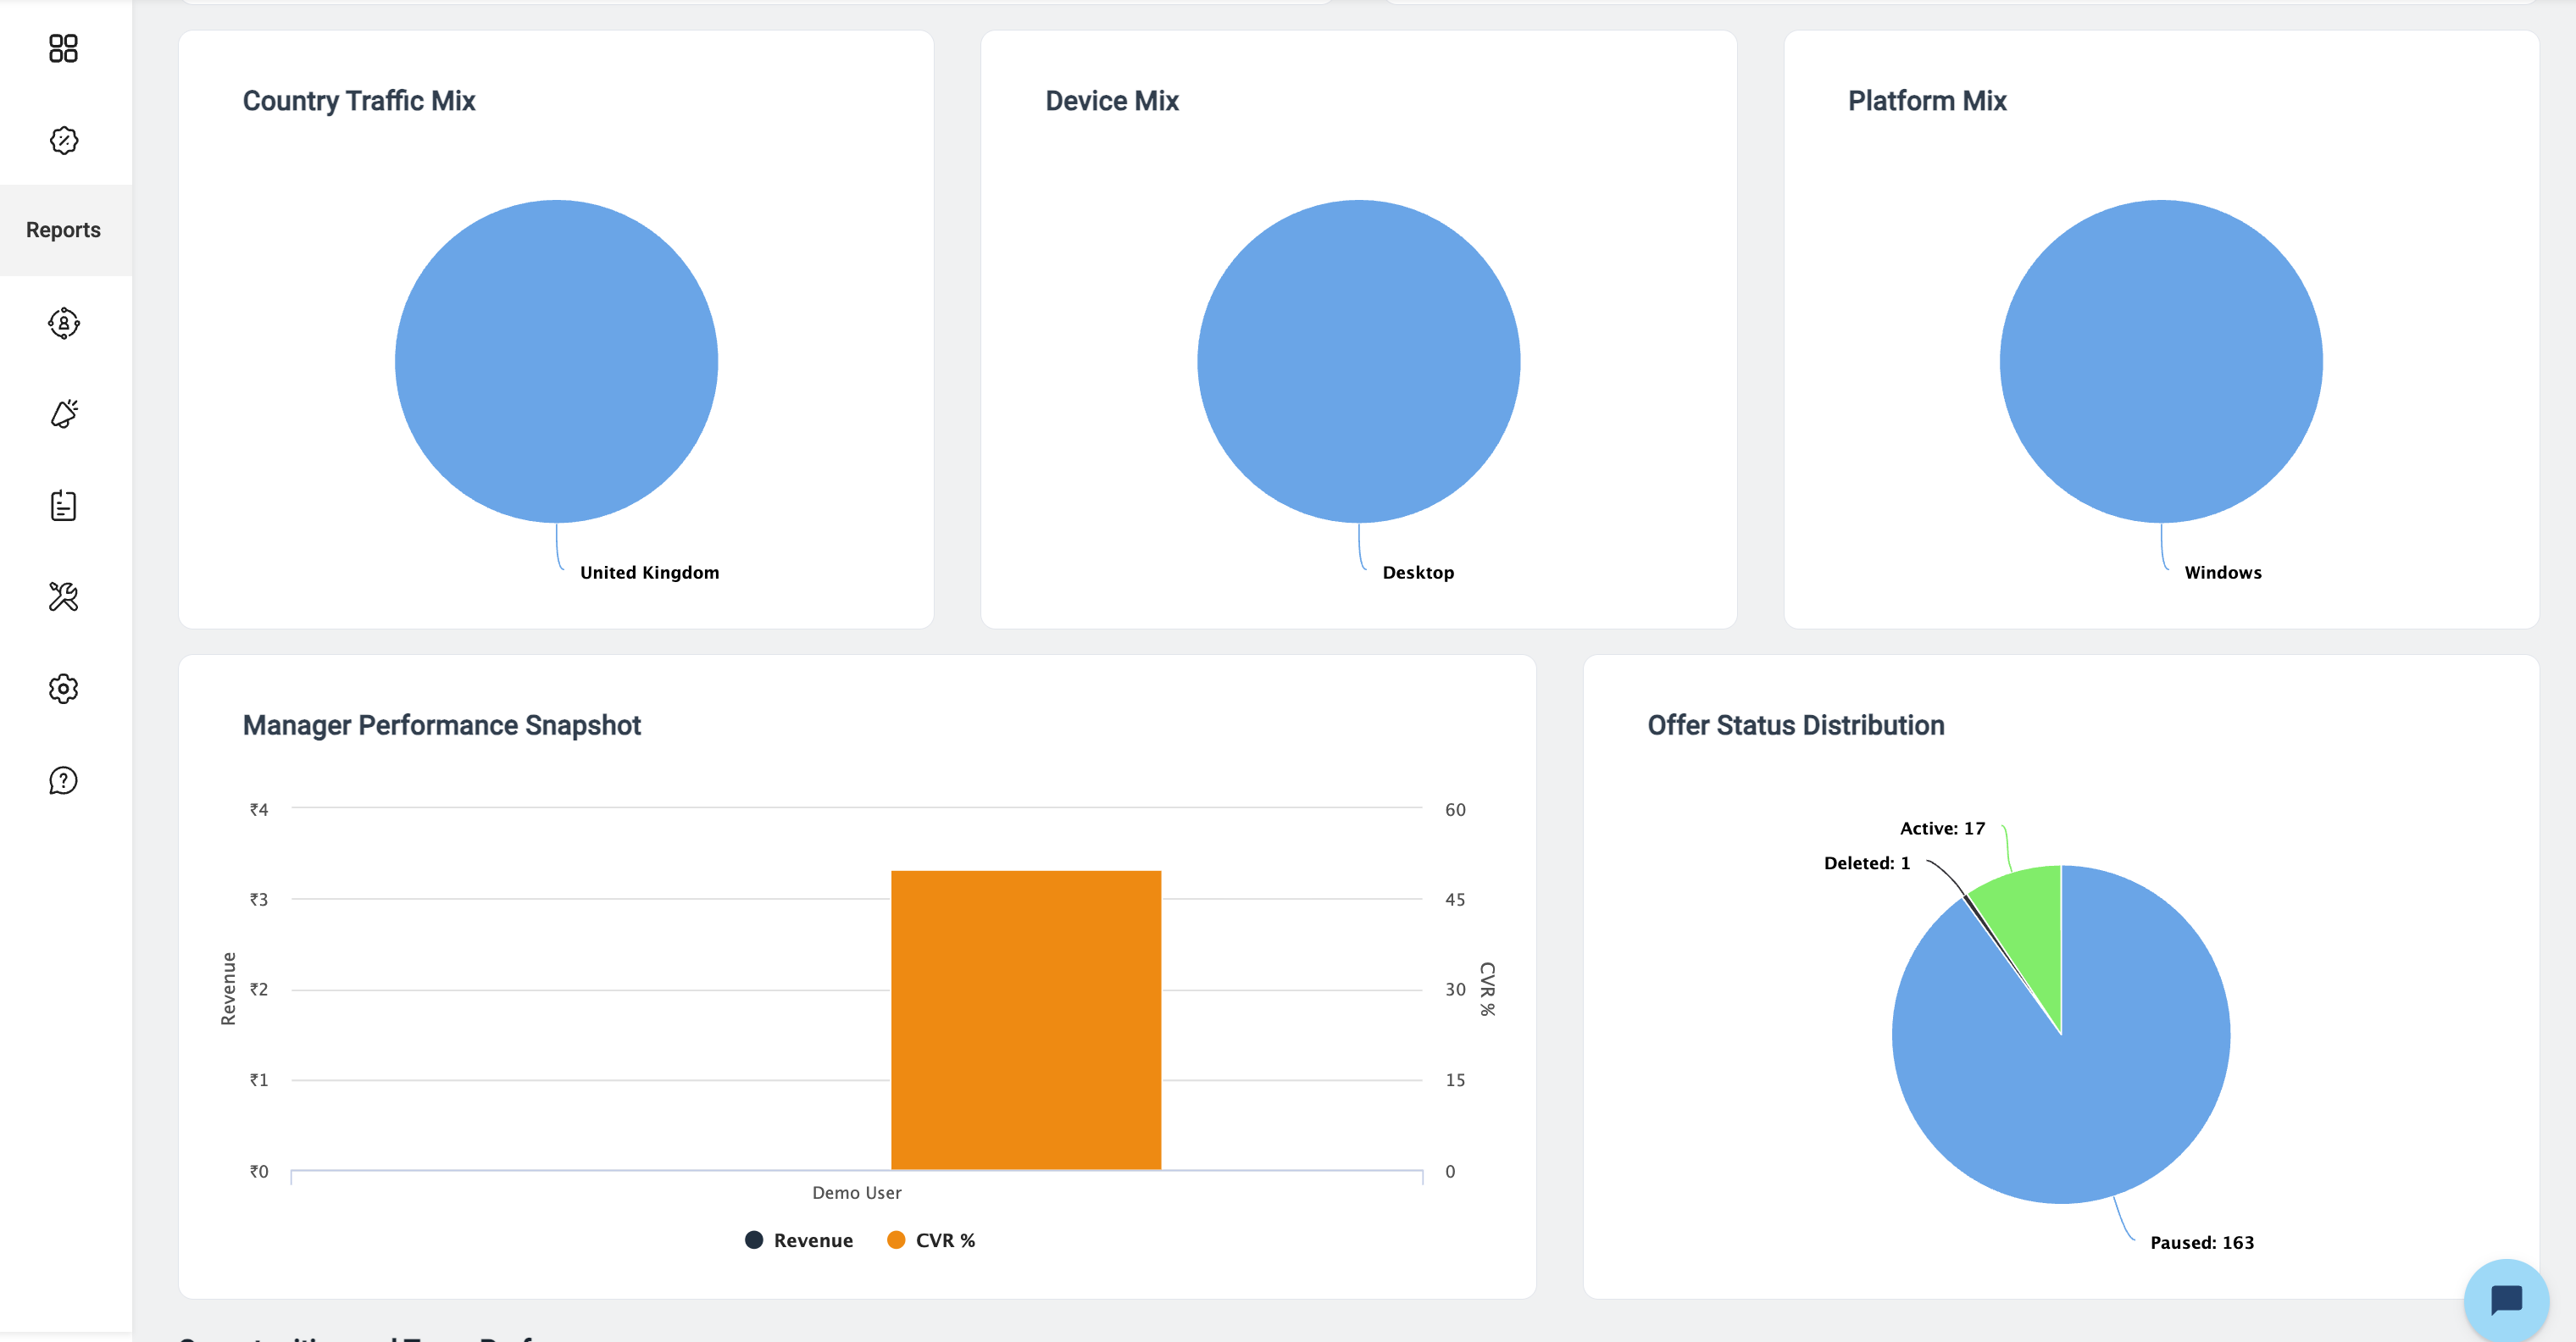
Quickly identify top performing offers, best affiliates by payout, offer status distribution, and conversion opportunities. This makes partner management and scaling decisions much easier.
Visual Insights helps teams stay proactive with:
Helping your team respond faster to operational issues.
Affiliate data is valuable only when it’s easy to understand and act upon.
The Visual Insights feature is now live for OffersHub users.
We’ll continue improving the dashboard with more advanced analytics, filters, and optimization-focused insights in upcoming updates.